SigNoz is an open-source observability platform built on OpenTelemetry. We’re building an enterprise-grade alternative to fragmented monitoring stacks, with logs, metrics, traces, alerts, and dashboards in one place.
Choose how to run SigNoz
SigNoz Cloud (Recommended)
Fully managed SigNoz with a 30-day free trial, no credit card required, usage-based pricing that starts at $49, and regional data hosting.
Enterprise Cloud, BYOC, or Enterprise Self-Hosted with compliance, support, custom retention, RBAC, ingestion controls, data residency, and region selection.
SigNoz helps teams debug production issues faster by connecting logs, metrics, traces, alerts, dashboards, exceptions, and agent-native workflows in one place.
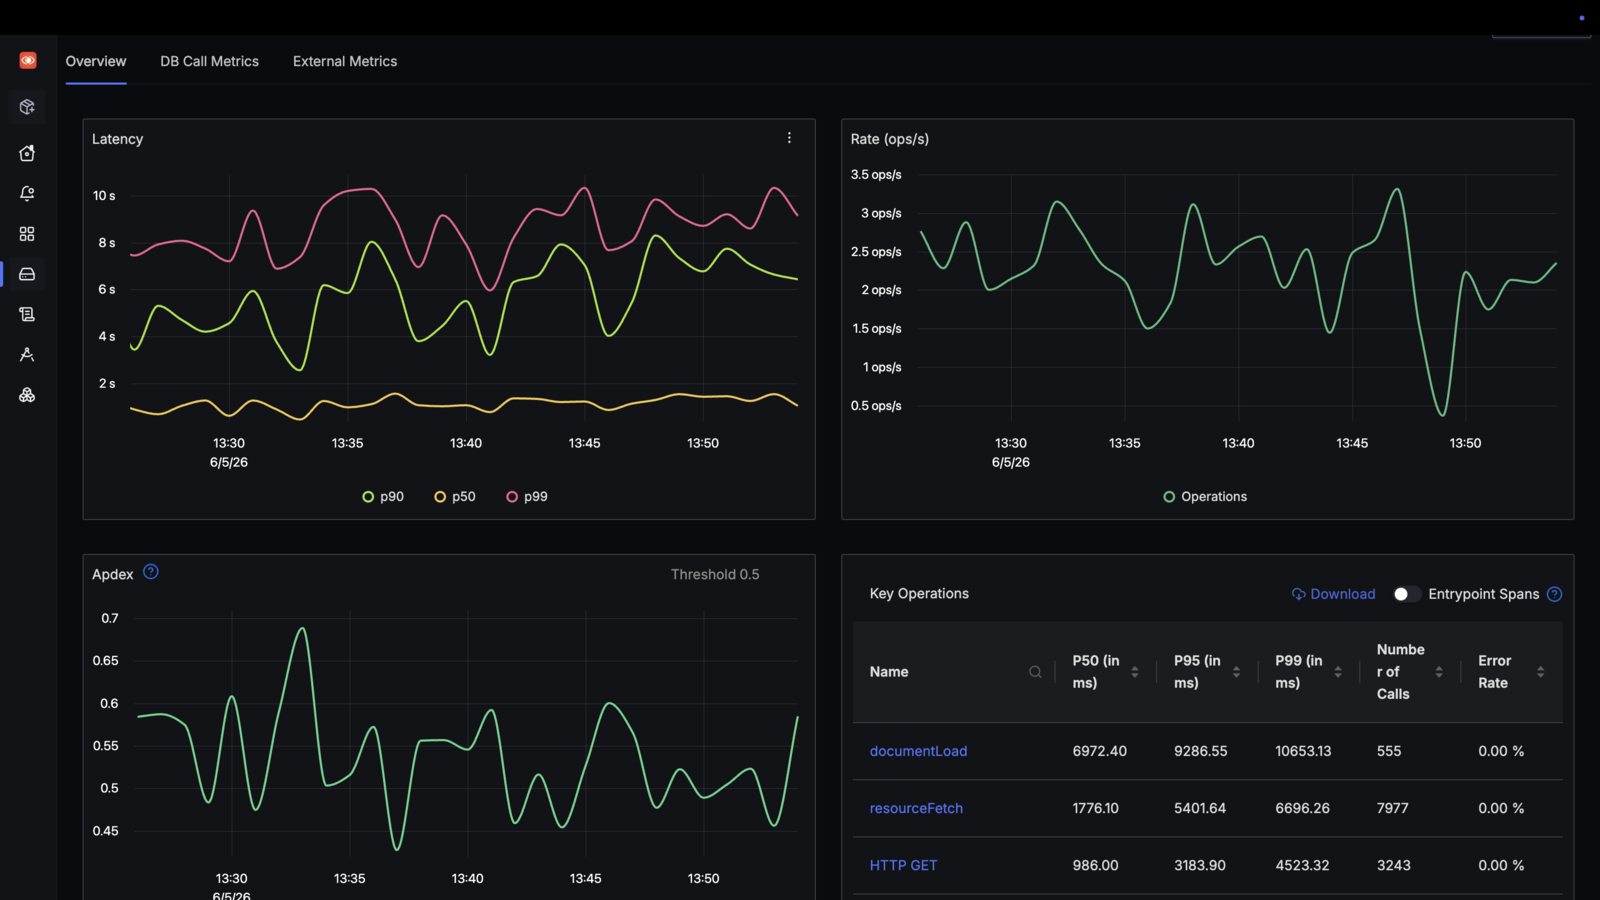
APM Overview
Monitor service latency, error rate, throughput, Apdex, top endpoints, database calls, and external calls.
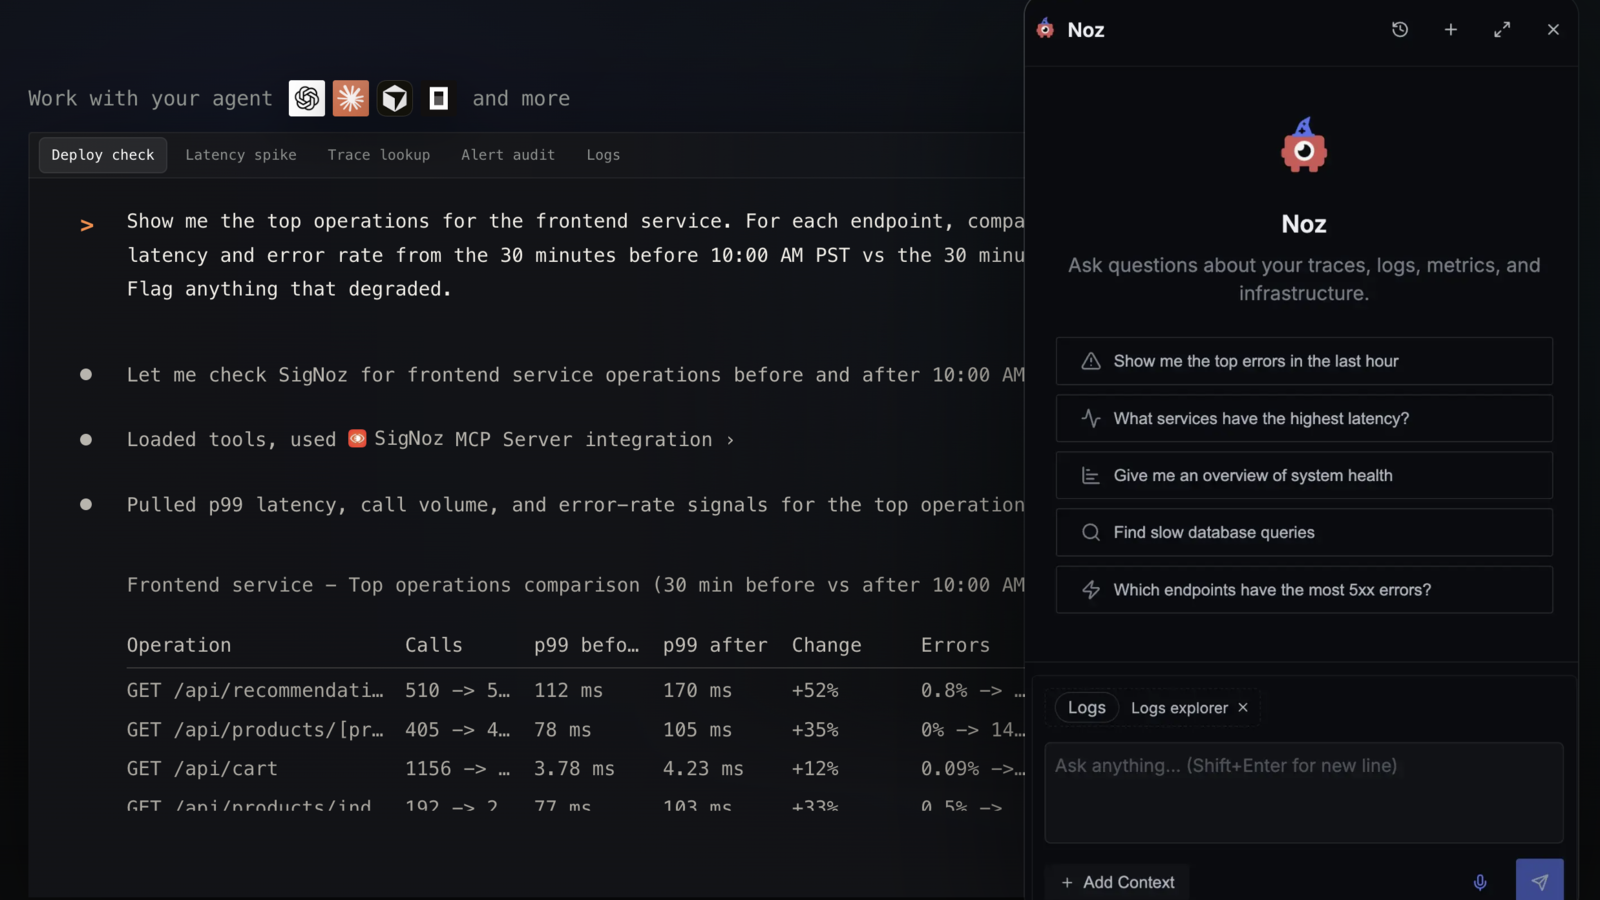
Use the SigNoz MCP server to bring telemetry into coding agents, or use Noz inside SigNoz to investigate incidents, tune alerts, and build dashboards with production context. Noz is available only on SigNoz Cloud.
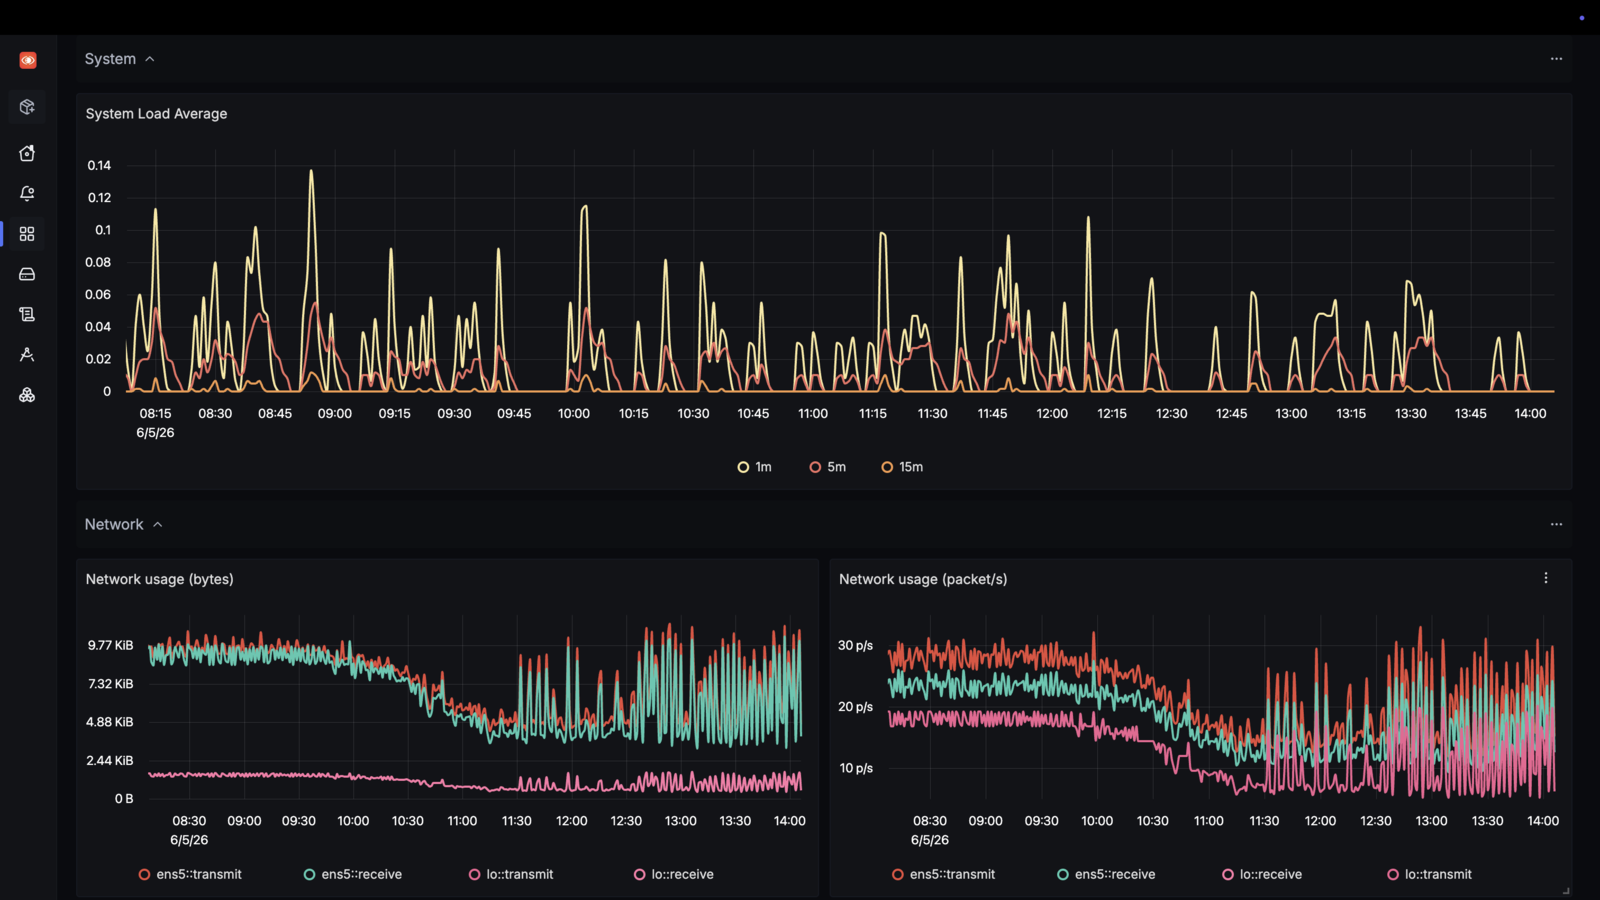
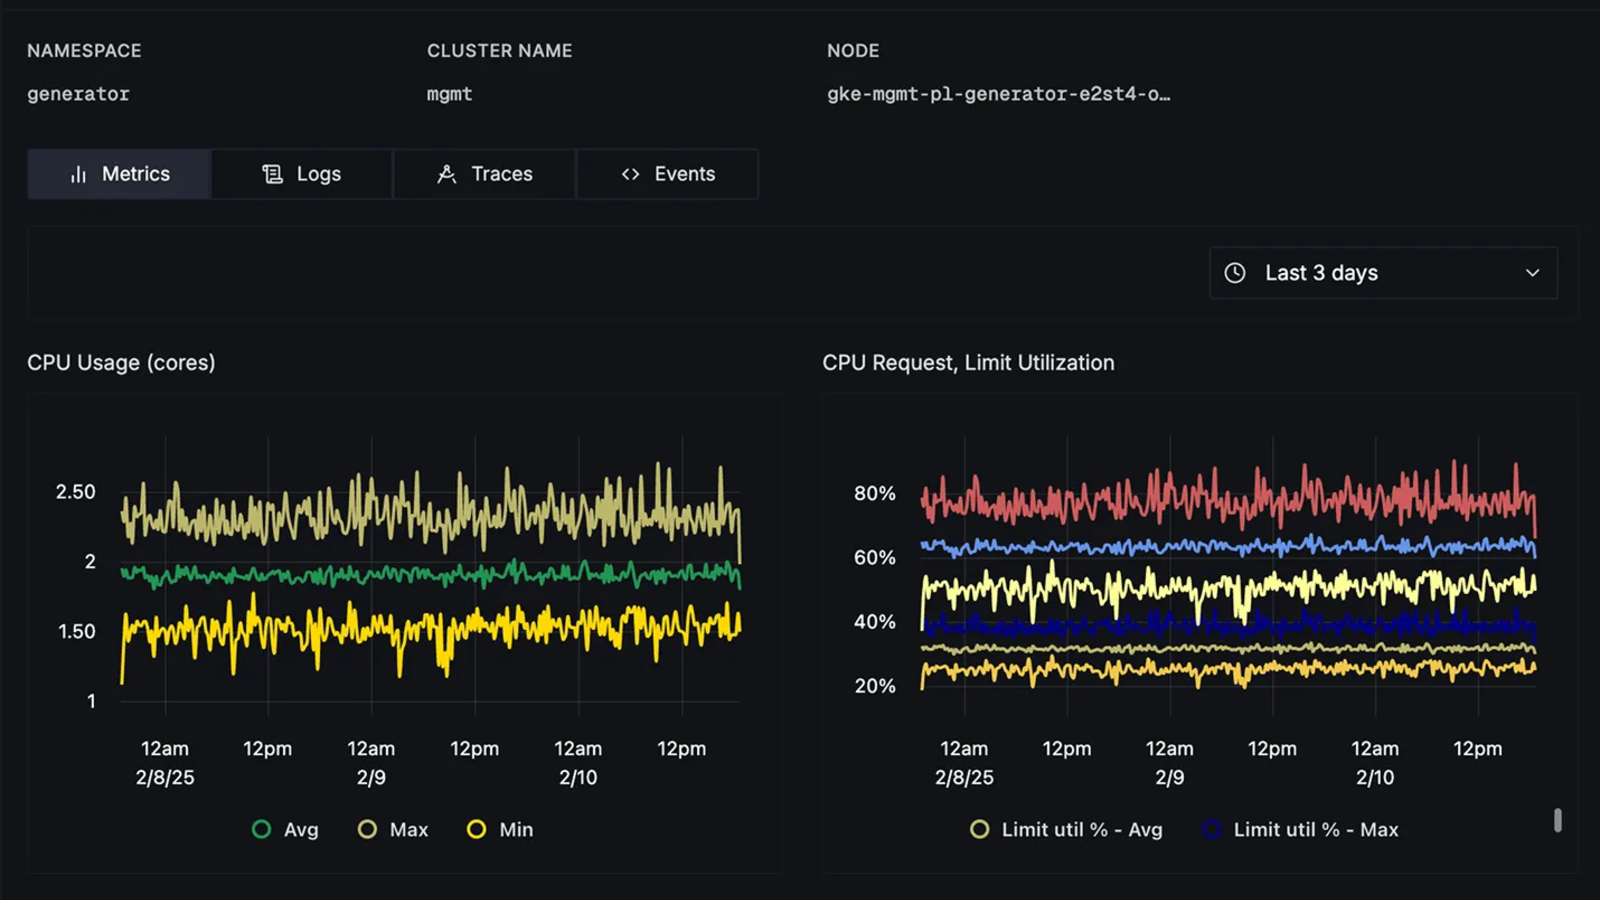
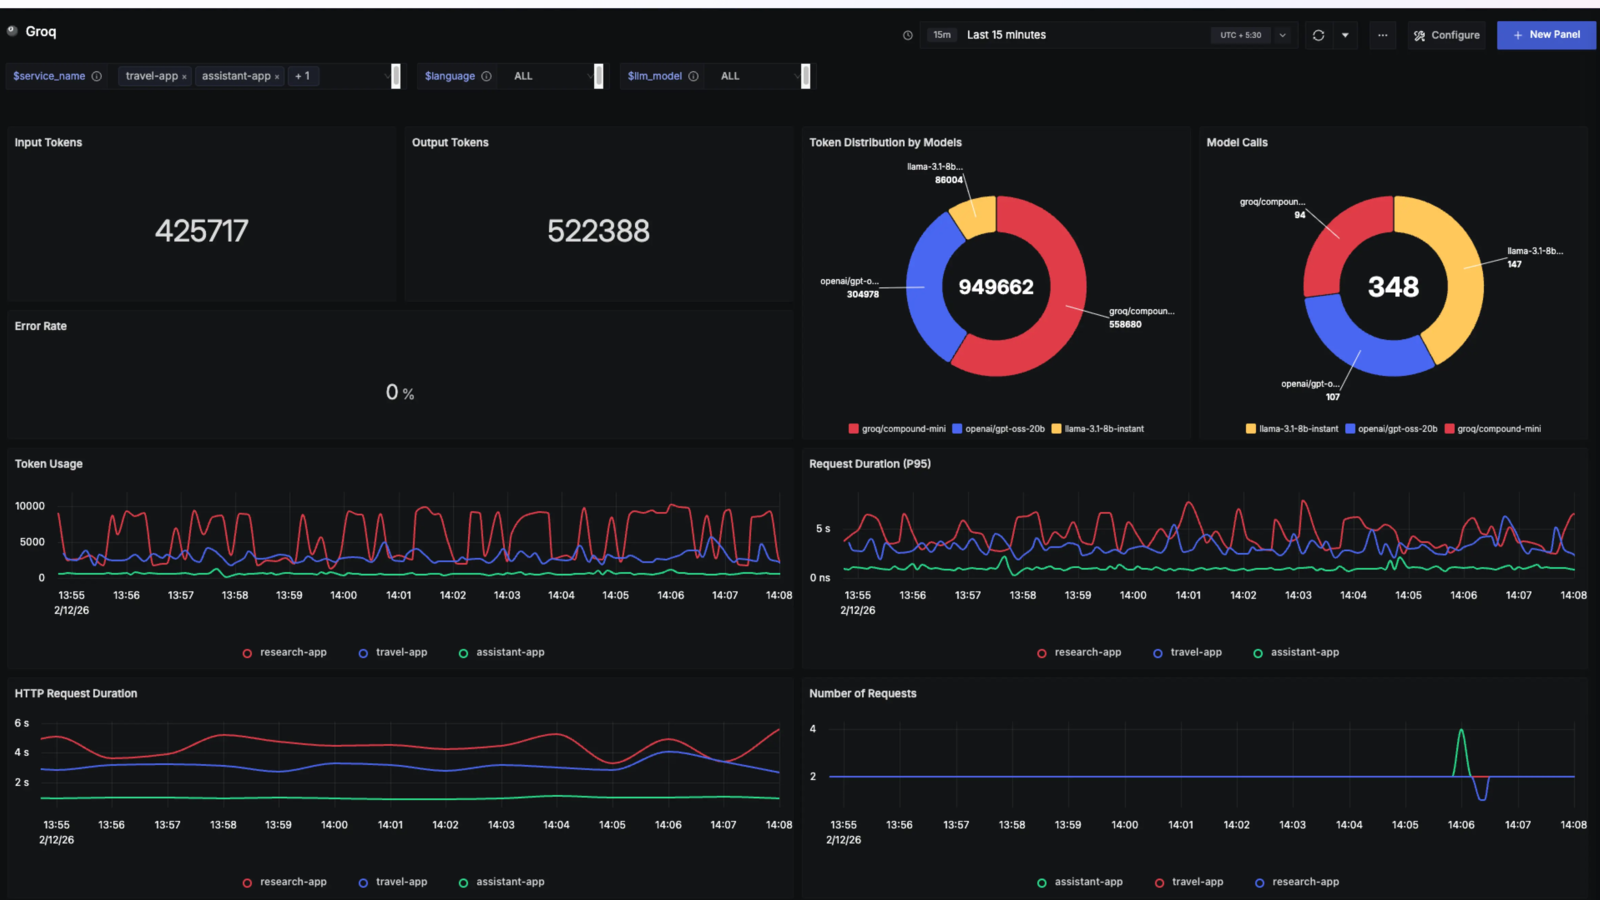
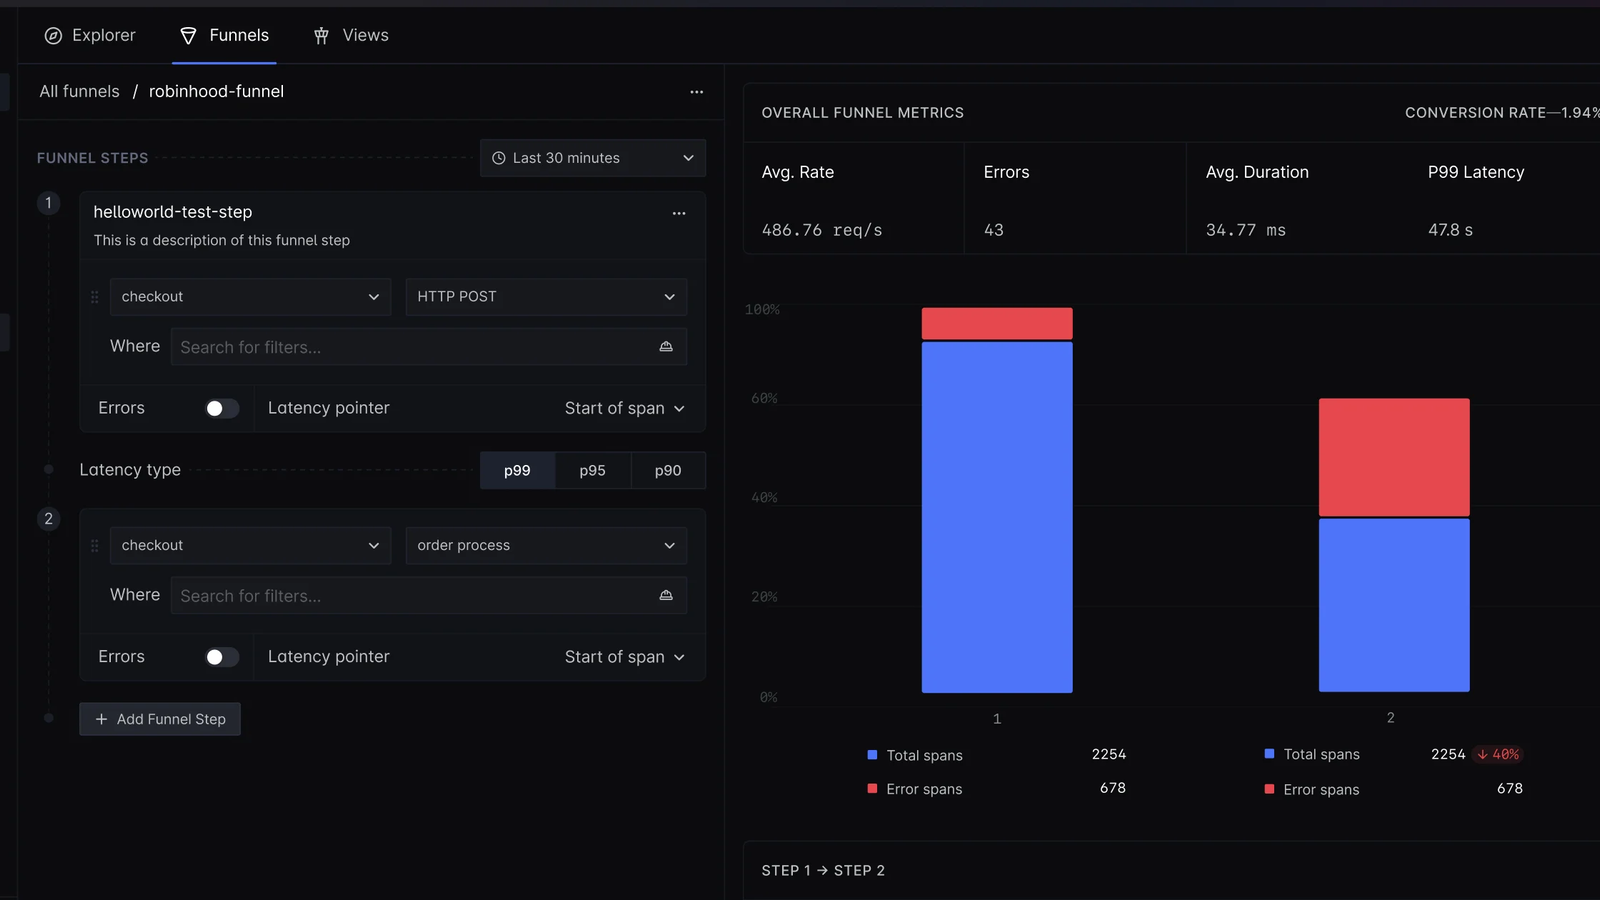
Also monitor: exceptions, alerts, external APIs, and integrations for OpenTelemetry, Prometheus, Kubernetes, cloud providers, language SDKs, application frameworks, databases, and LLM tools.
Why teams use SigNoz
OpenTelemetry-native
Instrument once with open standards and keep ownership of your telemetry.
Correlated signals
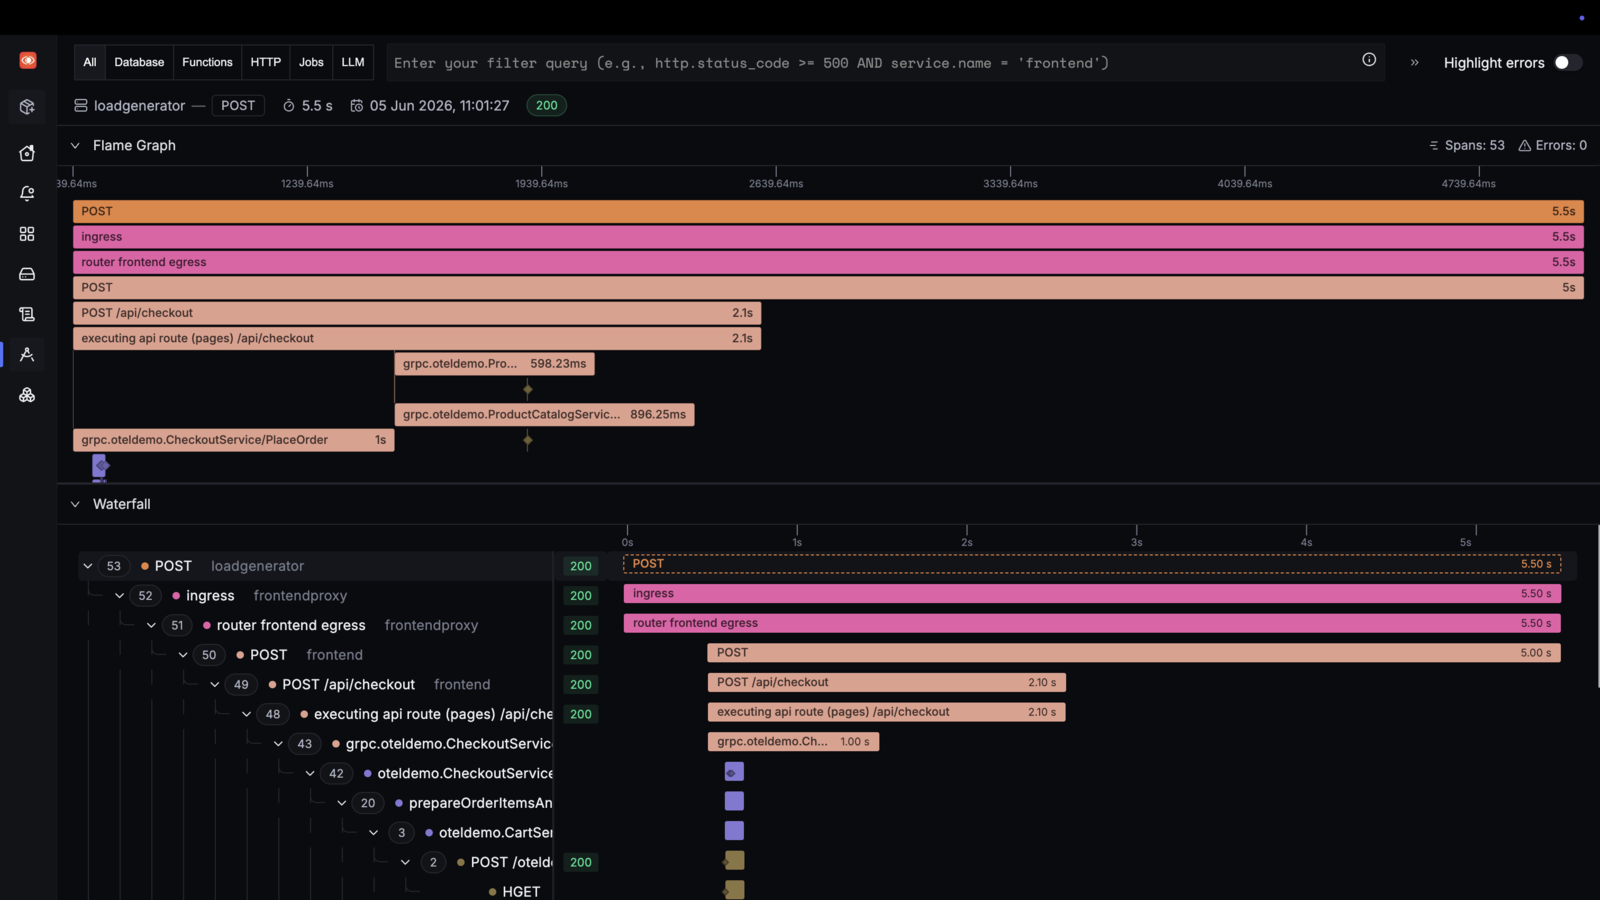
Move from service charts to traces, logs, infra metrics, and exceptions without switching tools.
Single columnar database
Built for high-cardinality, high-volume observability workloads.
Predictable pricing
No per-host pricing, no user-seat pricing, and no special pricing for custom metrics.
Enterprise ready
SOC 2 Type II and HIPAA compliance, RBAC, ingestion controls, custom retention, support, BYOC, and self-hosting.
Getting started
Start on Cloud
Create a managed SigNoz workspace and get your first dashboard without running observability infrastructure.
SigNoz is often adopted by teams moving from a stack of single-purpose tools or commercial platforms with unpredictable pricing.
Prometheus
Good if you just need metrics. SigNoz keeps metrics, logs, traces, dashboards, and alerts together so teams can debug with correlated context.
Jaeger
Jaeger only does distributed tracing. SigNoz adds metrics, logs, trace analytics, dashboards, alerts, exceptions, and trace-to-log workflows.
Elastic
SigNoz uses columnar database for efficient observability analytics and high-cardinality log workloads, with 50% lower resource requirement compared to Elastic during ingestion. Check the detailed study.
Loki
In the linked benchmark, SigNoz indexed all keys in the test setup, while Loki hit max stream errors when more labels were added. Check the detailed study.
Contributing
We ❤️ contributions big or small. Please read CONTRIBUTING.md to get started with making contributions to SigNoz.
Not sure how to get started? Just ping us on #contributing in our slack community.