Use this skill to build, implement, and test Vizro dashboards (Phase 2). Activate when the user wants to create a working app, says "just build it", or has data ready for implementation. Requires spec files from the dashboard-design skill (Phase 1), or user confirmation to skip design.
Requires Phase 1 spec files from the dashboard-design skill: spec/1_information_architecture.md, spec/2_interaction_ux.md, and spec/3_visual_design.md. If these do not exist, ask the user whether to run Phase 1 first or proceed without specs.
Guidelines
Use your native tools to understand the data well, especially if you build custom charts or when you use specific selectors.
If the user asks for an example, simply copy the example app and run it. Do not include your own data or change the example.
When executing any script mentioned below for the first time, it may take a while to install dependencies. Plan accordingly before taking any rash actions.
When iterating on the dashboard after completing all steps, do not forget key points from below, especially regarding spec compliance and updating and terminal handling: always keep all specs up to date, and always check if terminal output is clean after each iteration.
Execute all scripts from this skill, and the app.py you will create, with uv run <script_name>.py or uv run app.py - this will ensure you use the correct dependencies and versions.
ABSOLUTELY NEVER type ANY commands (including sleep, echo, or anything else) in the terminal where the dashboard app is running, even if you started it with isBackground=true. This WILL kill the dashboard process. The dashboard startup takes time - be patient and let it run undisturbed.
Step 2 (Testing) is critical — do not skip it. Use Playwright MCP if available, otherwise use any browser automation tool in your environment.
Spec Files: Documenting Decisions
IMPORTANT: Each step produces a spec file in the spec/ directory to document reasoning, enable collaboration, and allow resumption in future sessions. Create the spec/ directory if it is not already present at the root of the project.
Step 1: Build dashboard
You MUST ALWAYS copy the example app over, and modify it - this ensures less errors!
Investigate about the Vizro model by executing the schema fetching script. ALWAYS DO this for all models that you need - do NOT assume you know it. Execute the script like so: uv run ./scripts/get_model_json_schema.py <model_name> <model_name2> ... where <model_name> is the name of the model you want to get the schema for (prints the full JSON schema for each model to stdout). You can get an overview of what is available by calling the overview script like so: uv run ./scripts/get_overview_vizro_models.py (prints all available model names with one-line descriptions to stdout).
Build the dashboard config by changing the copied example app. Important: Very often normal plotly express charts will not suffice as they are too simple. In that case, refer to the custom charts guide to create more complex charts. These MUST be added to the correct section in the python app. Call the custom chart function from the Graph model in your dashboard app.
Run your dashboard app with uv run <your_dashboard_app>.pyCRITICAL: After running this command, DO NOT run ANY other commands in that terminal. The dashboard takes time to start up (sometimes 10-30 seconds)
You MUST read the terminal to check for any errors, but do not put commands like sleep in it. Fix any warnings and even more important errors you encounter. ONLY once you see the dashboard running, inform the user. NEVER run any commands in that terminal after starting the dashboard.
When you iterate, no need to kill the dashboard, as we are using debug mode. Just save the file and it will reload automatically. Check the terminal occasionally for any failures. Once failed, you need to restart the dashboard.
Optimizations and common errors
Colors: For Plotly charts and KPI cards, do not add colors in code — Vizro template defaults apply automatically. Only add chart colors if spec/3_visual_design.md has an explicit ## Colors section. For AG Grid cell styling (conditional formatting, heatmaps), use from vizro.themes import palettes, colors — never invent hex values. See selecting-vizro-charts skill.
Data loading: For dashboards needing data refresh (databases, APIs) or performance optimization, see the data management guide for static vs dynamic data, caching, and best practices.
KPI cards: Use built-in kpi_card / kpi_card_reference in Figure model only. Never rebuild as custom charts (exception: dynamic text). See selecting-vizro-charts skill.
Tables: Use vm.Table with figure=dash_ag_grid(...) only. Never the Dash DataTable backing (dash_data_table, removed in Vizro 1.0.0), never fake-table with Plotly. See example_ag_grid.py for the two canonical patterns and the Dash-AG-Grid / JS-AG-Grid knowledge mapping.
Interactions / actions: For cross-filter, cross-highlight, drill-through, or data export, load the wiring-vizro-actions skill and follow the ## Interactions section in spec/2_interaction_ux.md.
REQUIRED OUTPUT: spec/4_implementation.md
Copy the template from assets/4_implementation.md to spec/4_implementation.md at the project root, fill in the placeholders, and save it BEFORE proceeding to Step 2.
Validation Checklist
Before proceeding to Step 2, verify against spec files:
All specs from spec/1_information_architecture.md, spec/2_interaction_ux.md and spec/3_visual_design.md are implemented if specs exist
You have read the terminal output of the dashboard app for errors and warnings, you have not put any commands in the terminal after starting the app
Any deviations are documented in spec/4_implementation.md
Step 2: Testing
This step is critical for producing bug-free dashboards. Do NOT skip it.
When conducting the below tests, go back to Step 1 to fix any issues you find, then come back here.
Automated Code Validation
Run these validation scripts against your app.py to catch common issues:
Color validation: uv run ./scripts/validate_colors.py . — Checks for hardcoded colors (color_discrete_map, hex codes, plot_bgcolor) that bypass Vizro theming. Fix any FAIL. If the user explicitly asked for custom colors, add --custom-colors-requested to skip app.py color checks.
Aggregation validation: uv run ./scripts/validate_aggregation.py . — Checks that bar/line charts use pre-aggregated data via @capture("graph"), not raw detail rows passed to inline px.bar/px.line. Fix any FAIL.
Browser Testing
Navigate the running dashboard to catch errors that code review alone cannot find: (1) console errors on launch, (2) callback errors on page navigation, and (3) callback 500s when actions fire — these only surface when the user actually clicks an interactive source, never on load.
Determine which browser automation tool is available:
Playwright MCP tools available? → Use them directly to navigate, click pages, and check console. No Playwright MCP? → Install the Python package, then write a test script. Use uv pip install playwright && uv run playwright install --with-deps chromium — the --with-deps flag installs OS libraries Chromium needs and is required on slim Linux base images (Docker, CI runners, devcontainers) where the plain install will fail at launch with missing-shared-library errors. It is safe on macOS/Windows too. Skip the install if Chromium is already on disk — it is a ~170 MB download.
Approach — batch errors, don't loop one-at-a-time. Walk every page and exercise every action in one pass, collecting all errors (console, network 500s, callback failures, server tracebacks in the dashboard process output) into a single list. Then fix all of them in one batch of edits, restart the dashboard once, and re-walk. The trap to avoid: find-one-error → fix → restart → find-next-error → fix → restart. Each restart costs ~30–60 s and you will hit your time budget long before the dashboard is clean.
Using your chosen tool, perform these checks in a single walk:
Navigate to the dashboard URL (e.g., http://localhost:8050).
Visit every page and read the browser console for errors. Do not stop on the first error — record it and keep going.
If app.py contains any actions= (cross-filter, cross-highlight, drill-through, export), exercise each one in the same walk: grep your app for actions= and for every match, click the corresponding source (a point on the scatter, a bar, a row in the Table, the export Button, etc.). For each, record:
any browser console Callback error updating ... messages,
any network 500 response on _dash-update-component,
whether the action's intended effect actually happened (URL updated for show_in_url=True, target filter changed, highlight applied, file downloaded, etc.).
Also check the dashboard process output (the terminal you started app.py in) for server-side tracebacks — these surface the root cause when the browser only shows a generic callback error.
Group the collected failures, apply all fixes in one batch, restart, and re-run this walk. Repeat only if new errors appear.
Advanced Testing flow
Take a screenshot of each page, compare to specs and especially wireframes
Document any discrepancies
Important things to check:
Line charts are readable, and not a mess due to lack of aggregation
Graphs are legible and not squashed due to Layout
REQUIRED OUTPUT: spec/5_test_report.md
Copy the template from assets/5_test_report.md to spec/5_test_report.md at the project root, fill in the placeholders, and save it to complete the project.
Done When
Validation scripts (validate_colors.py, validate_aggregation.py) both PASS
Dashboard launches without errors, no console errors, no callback errors on page navigation
Every actions= in app.py has been clicked in the browser and produced its intended effect with no callback 500
User confirms requirements are met
All spec files from this Phase 2 saved in spec/ directory
Use it to build beautiful and powerful data visualization apps quickly and easily, without needing advanced engineering or visual design expertise.
Then customize and deploy your app to production at scale.
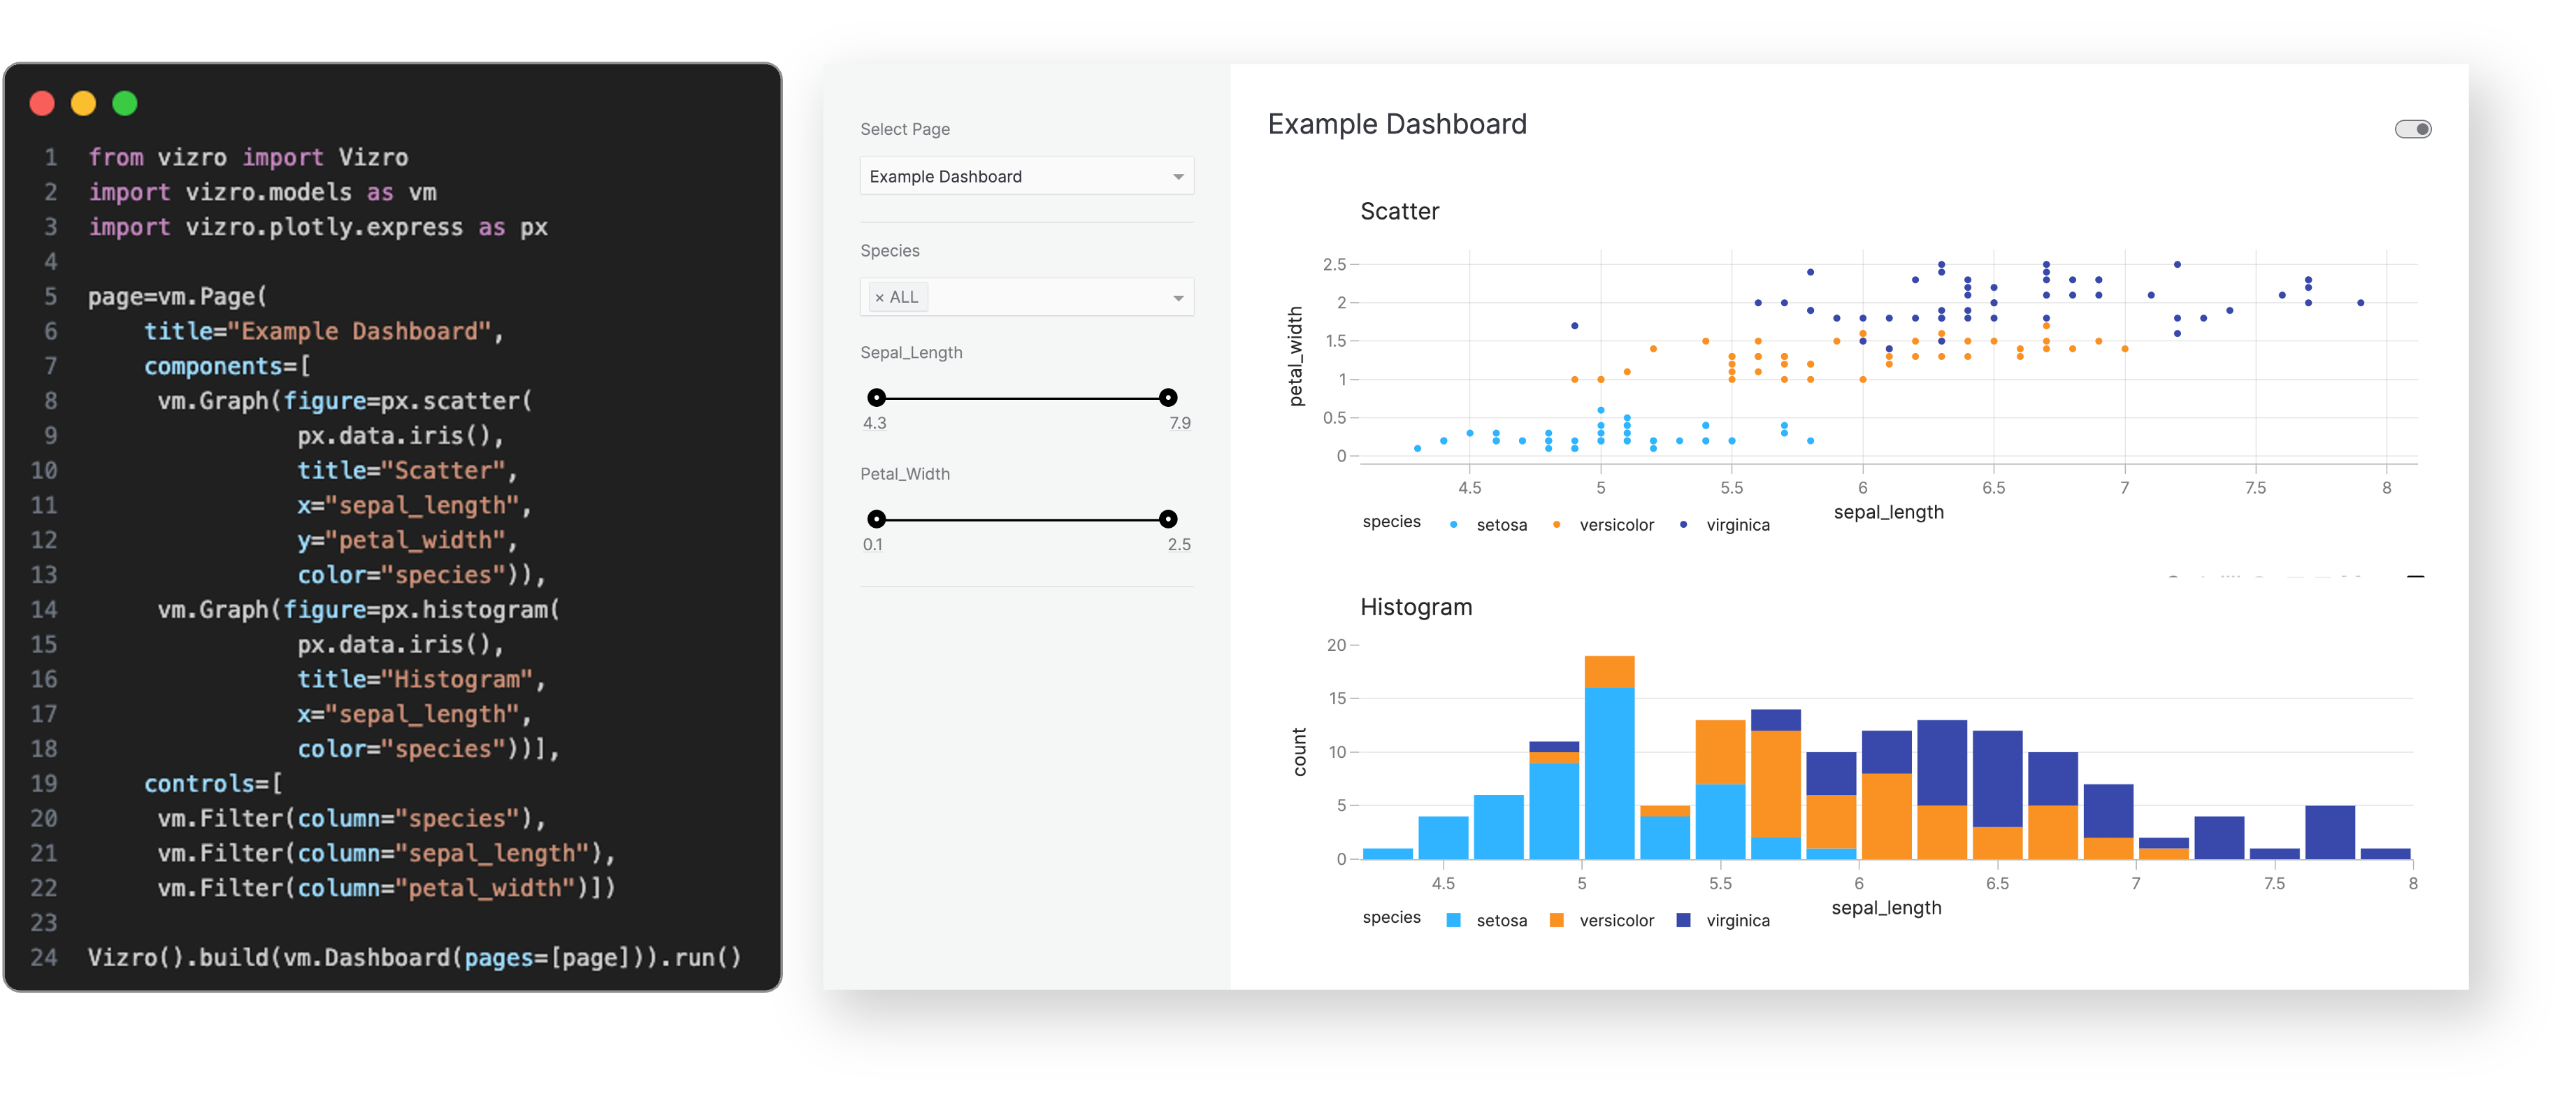
In just a few lines of simple low-code configuration, with in-built visual design best practices, you can quickly assemble high-quality, multi-page prototypes, that are production-ready.
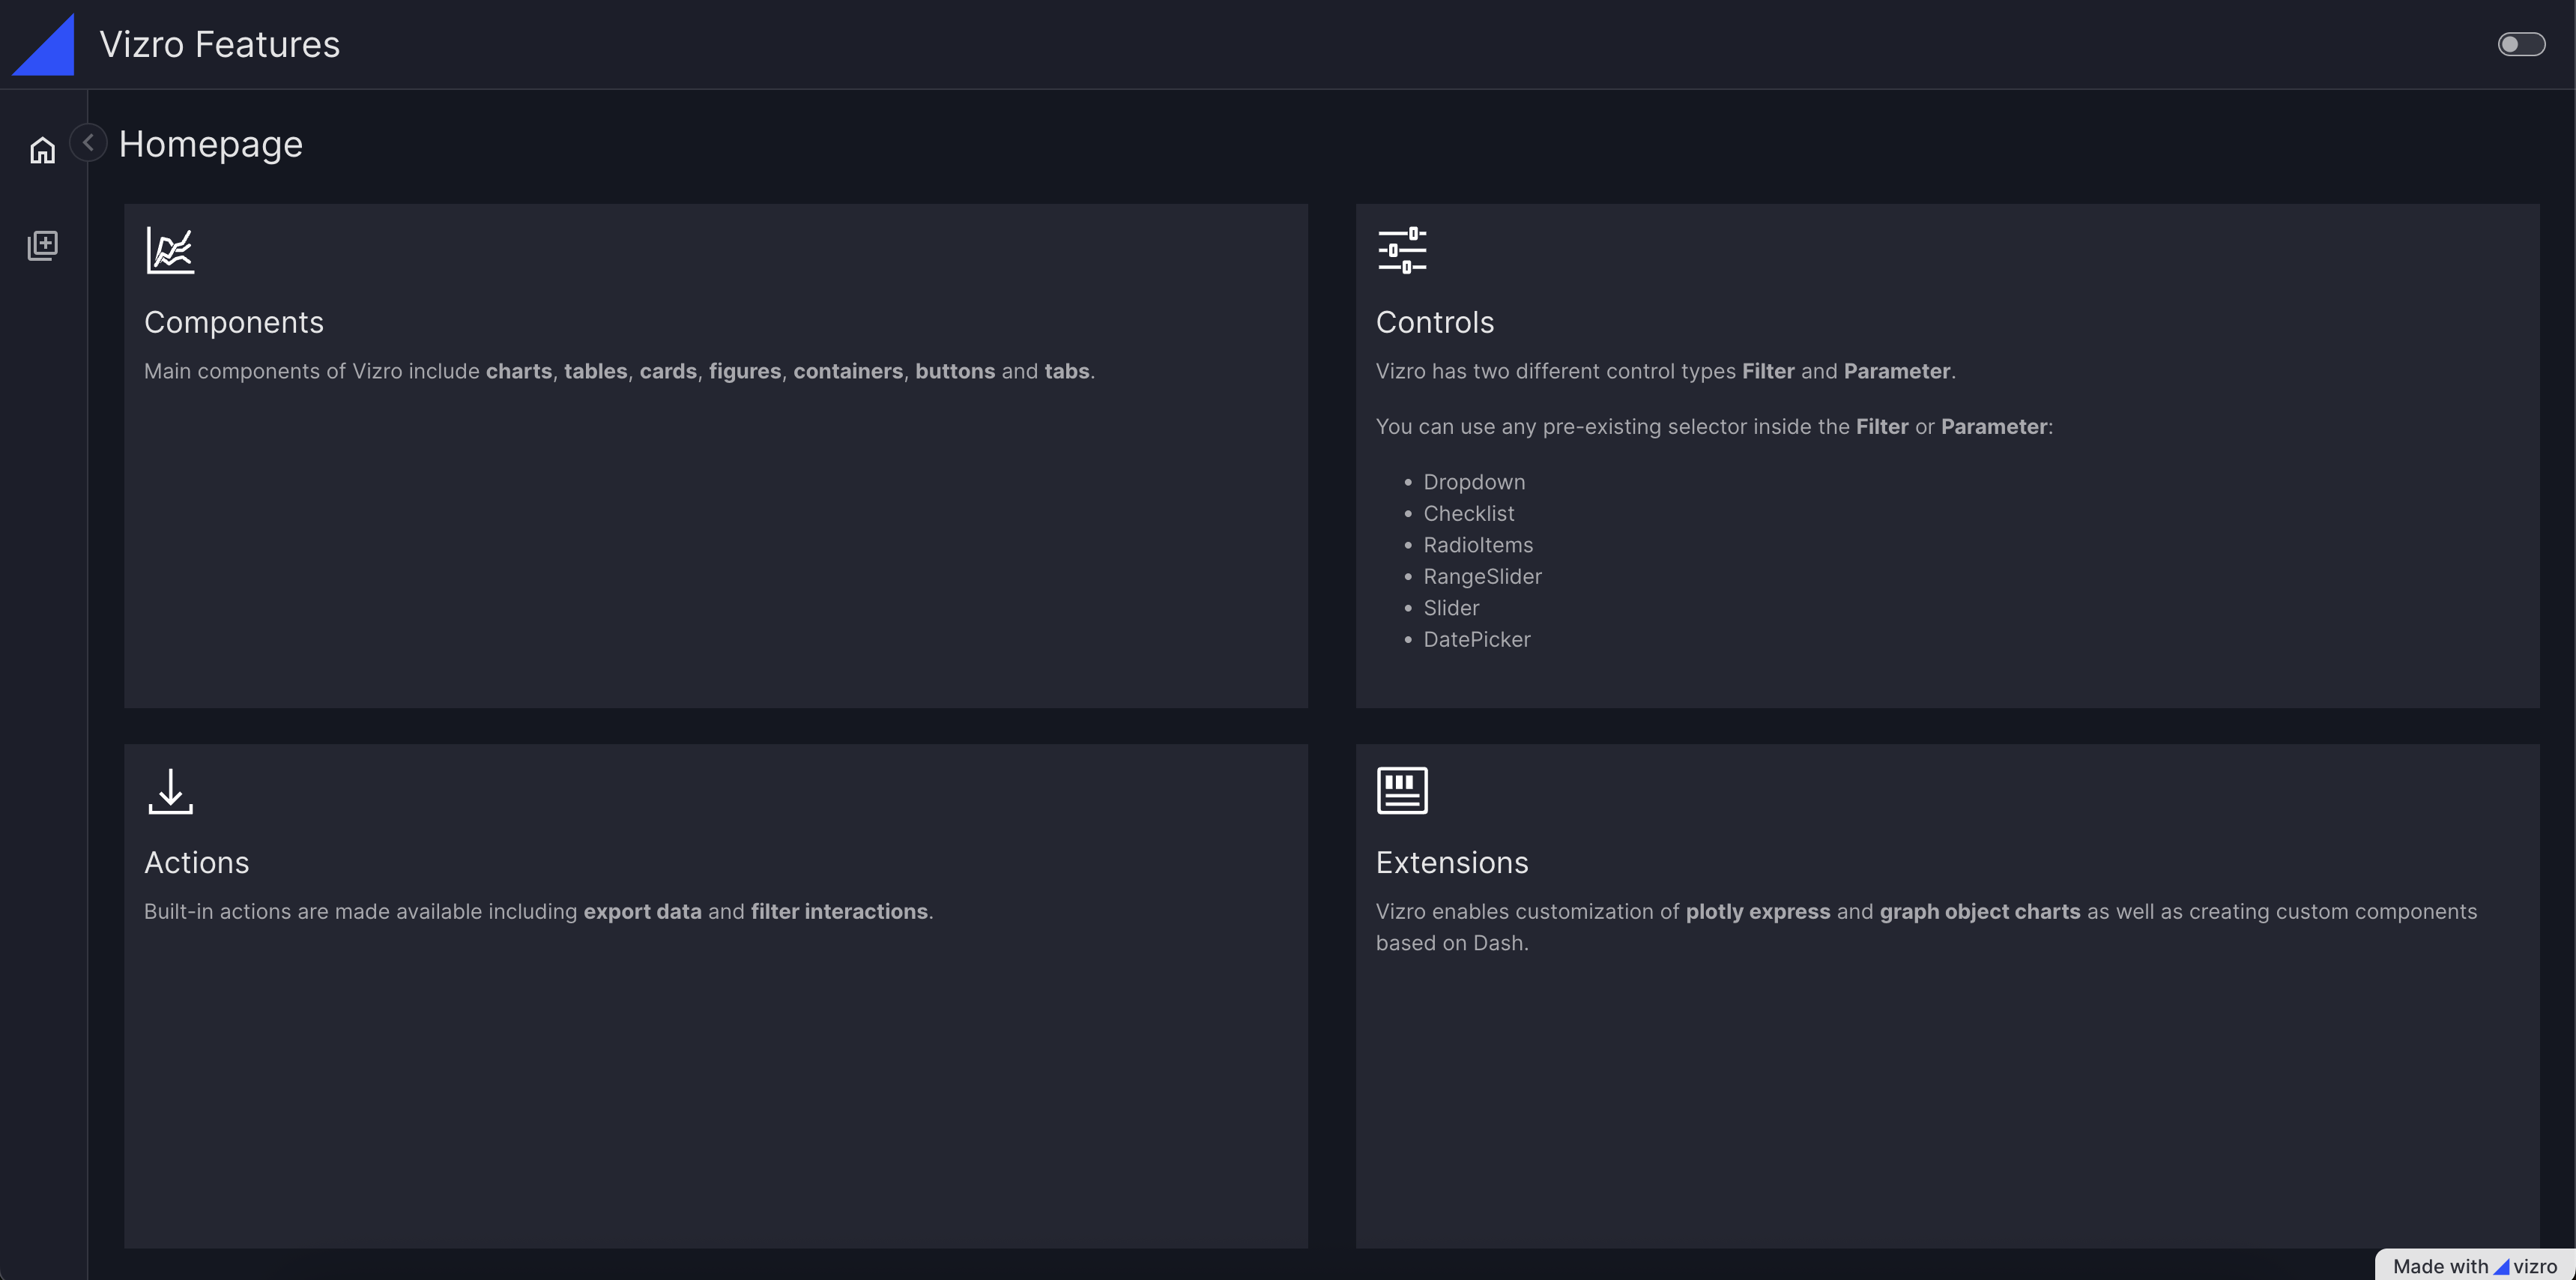
Every Vizro app is defined by a simple configuration, using these high-level categories:
Components: charts, tables, cards, KPI indicators, forms and more.
Controls: filters and parameters, using a range of selectors such as drop-down menus and sliders.
Actions: interactions between components, drill-throughs, export functionality and more.
Layouts: grid layouts or flexible containers, with a range of pre-set styles.
Navigation: a range of app layout and navigation settings, including nested page hierarchies.
Configuration can be written in multiple formats including Pydantic models, JSON, YAML or Python dictionaries for added flexibility of implementation.
Optional high-code extensions enable almost infinite customization in a modular way, combining the best of low-code and high-code - including bespoke visual formatting and custom components.
Visit the "How-to guides" for a more detailed explanation of Vizro features.
Why use Vizro?
The benefits of the Vizro toolkit include:
Vizro helps you to build data visualization apps that are:
Quick and easy
Build apps in minutes. Use a few lines of simple configuration (via Pydantic models, JSON, YAML, or Python dictionaries) in place of thousands of lines of code.
Beautiful and powerful
Build high-quality multi-page apps without needing advanced engineering or visual design expertise. Use powerful features of production-grade BI tools, with in-built visual design best practices.
Flexible
Benefit from the capabilities and flexibility of open-source packages. Use the trusted dependencies of Plotly, Dash, and Pydantic.
Customizable
Almost infinite control for advanced users. Use Python, JavaScript, HTML and CSS code extensions.
Scalable
Rapidly prototype and deploy to production. Use the in-built production-grade capabilities of Plotly, Dash and Pydantic.
Use Vizro when you need to combine the speed and ease of low-code Python tools, with production capabilities of JavaScript and BI tools, and the freedom of open source:
Have an app that looks beautiful and professional by default.
Enjoy the simplicity of low-code, plus the option to customize with code almost infinitely.
Rapidly create prototypes which are production-ready and easy to deploy at scale.
How to use Vizro?
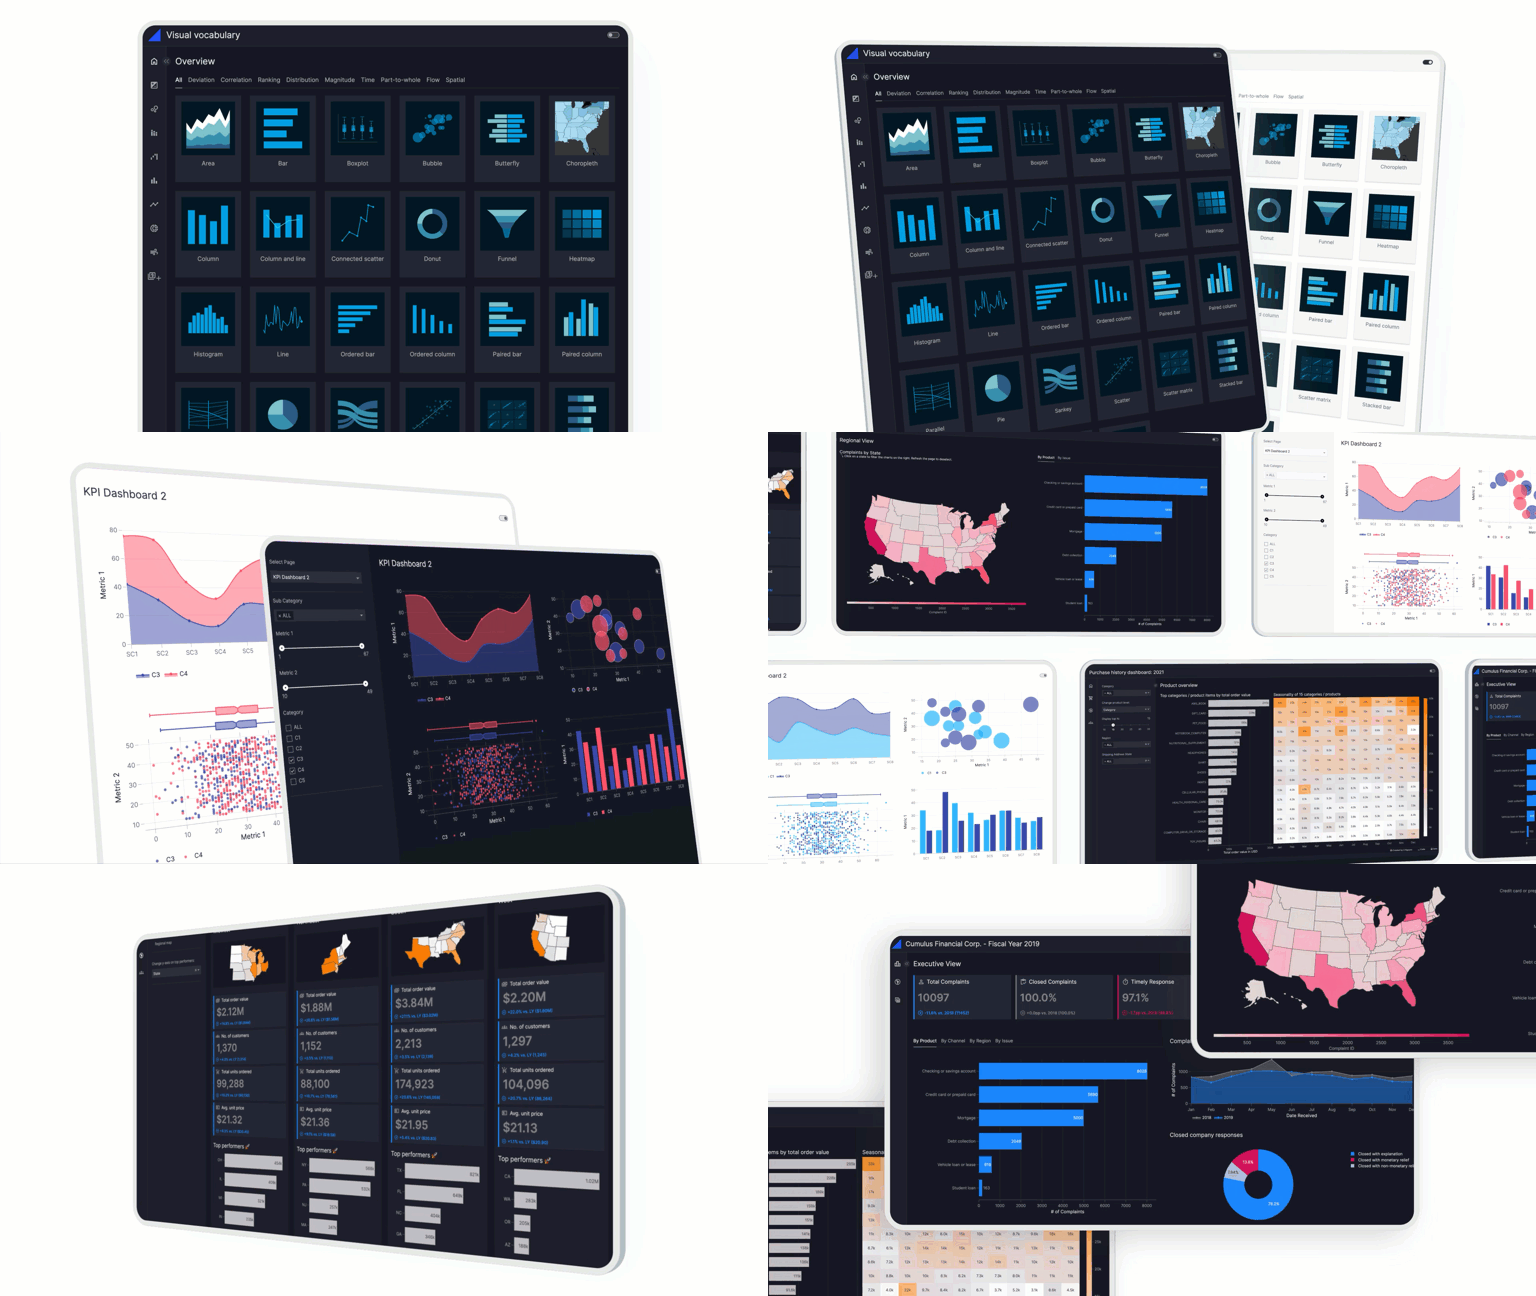
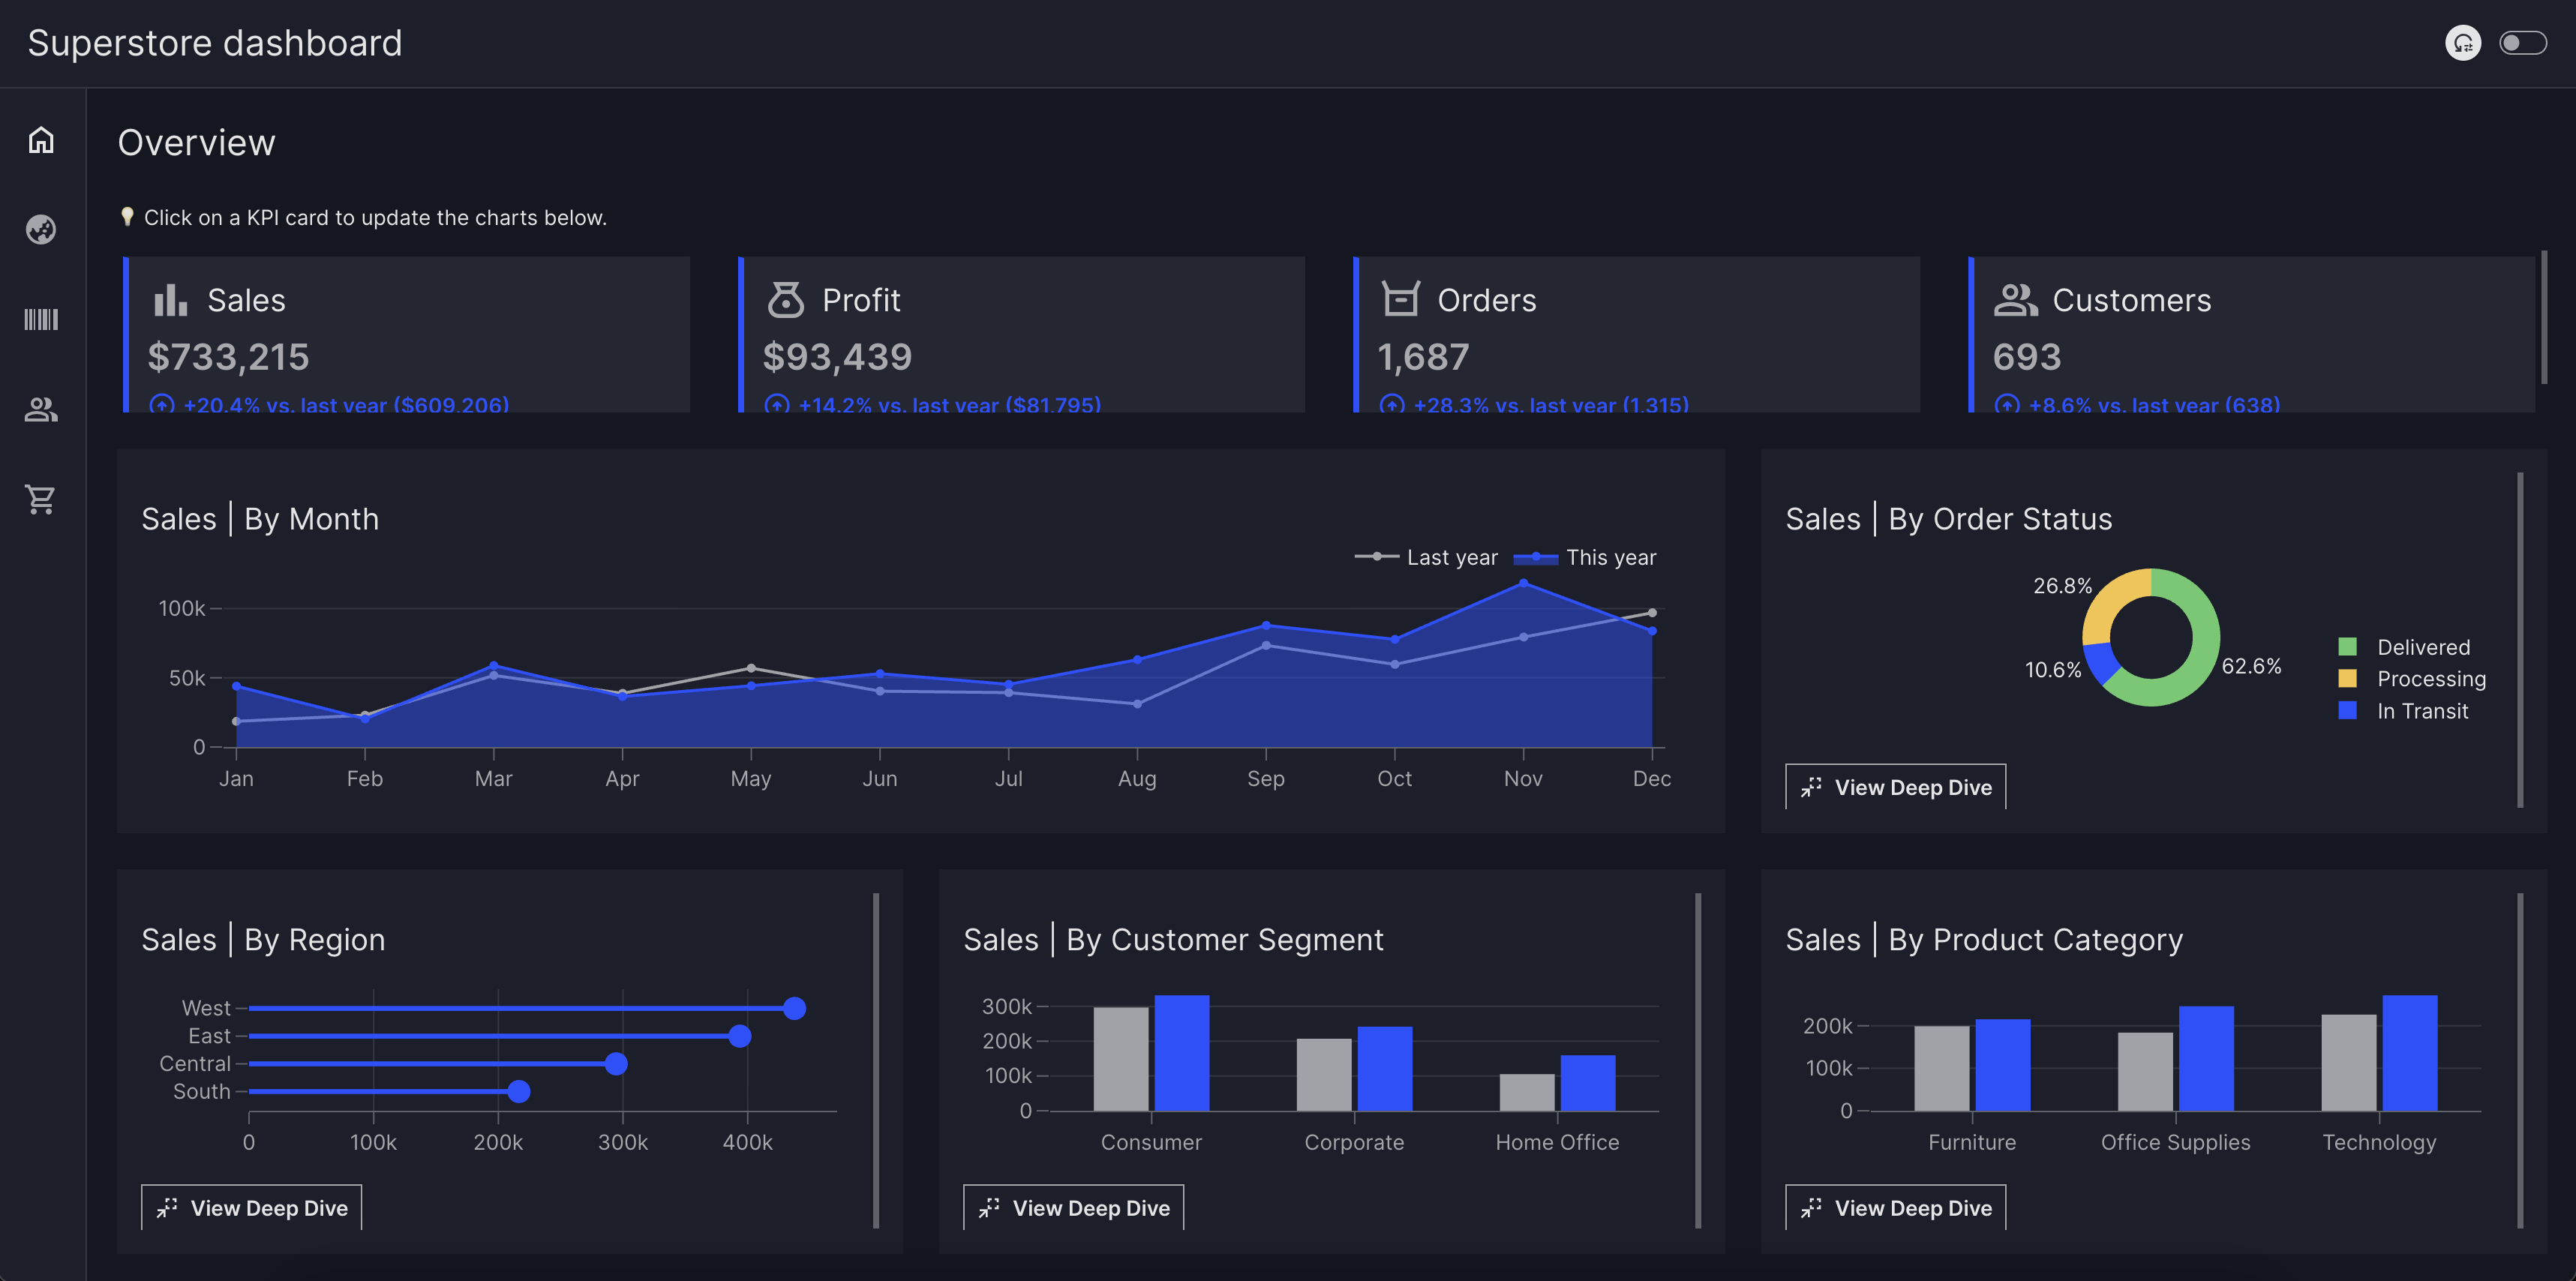
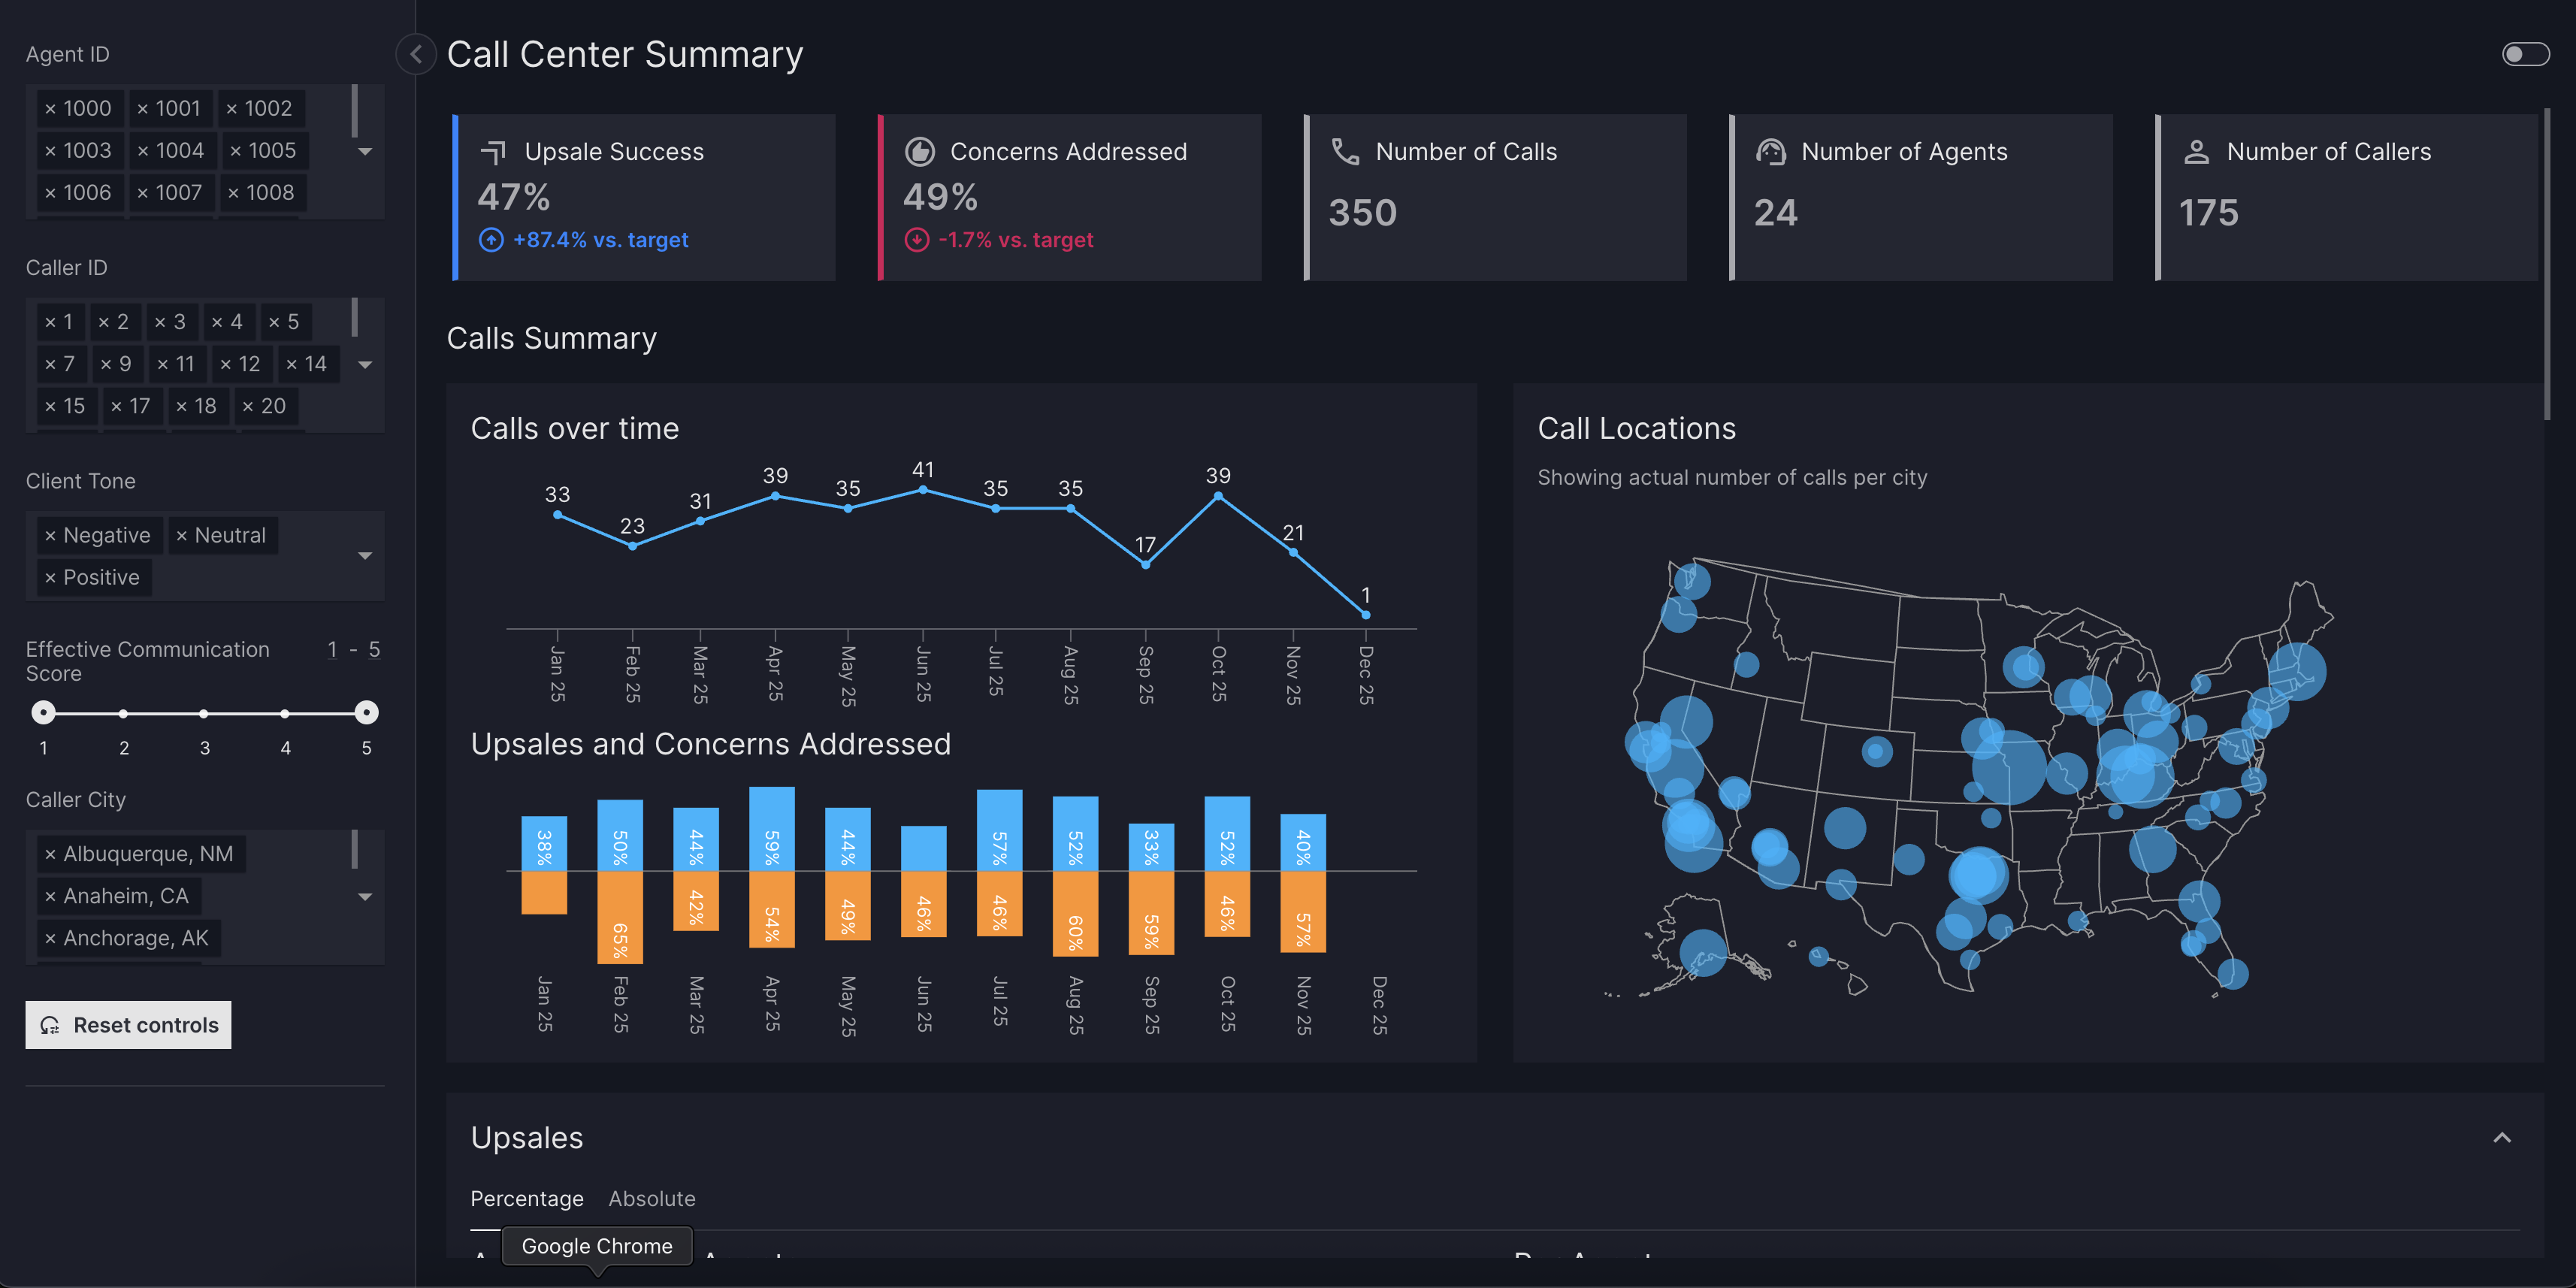
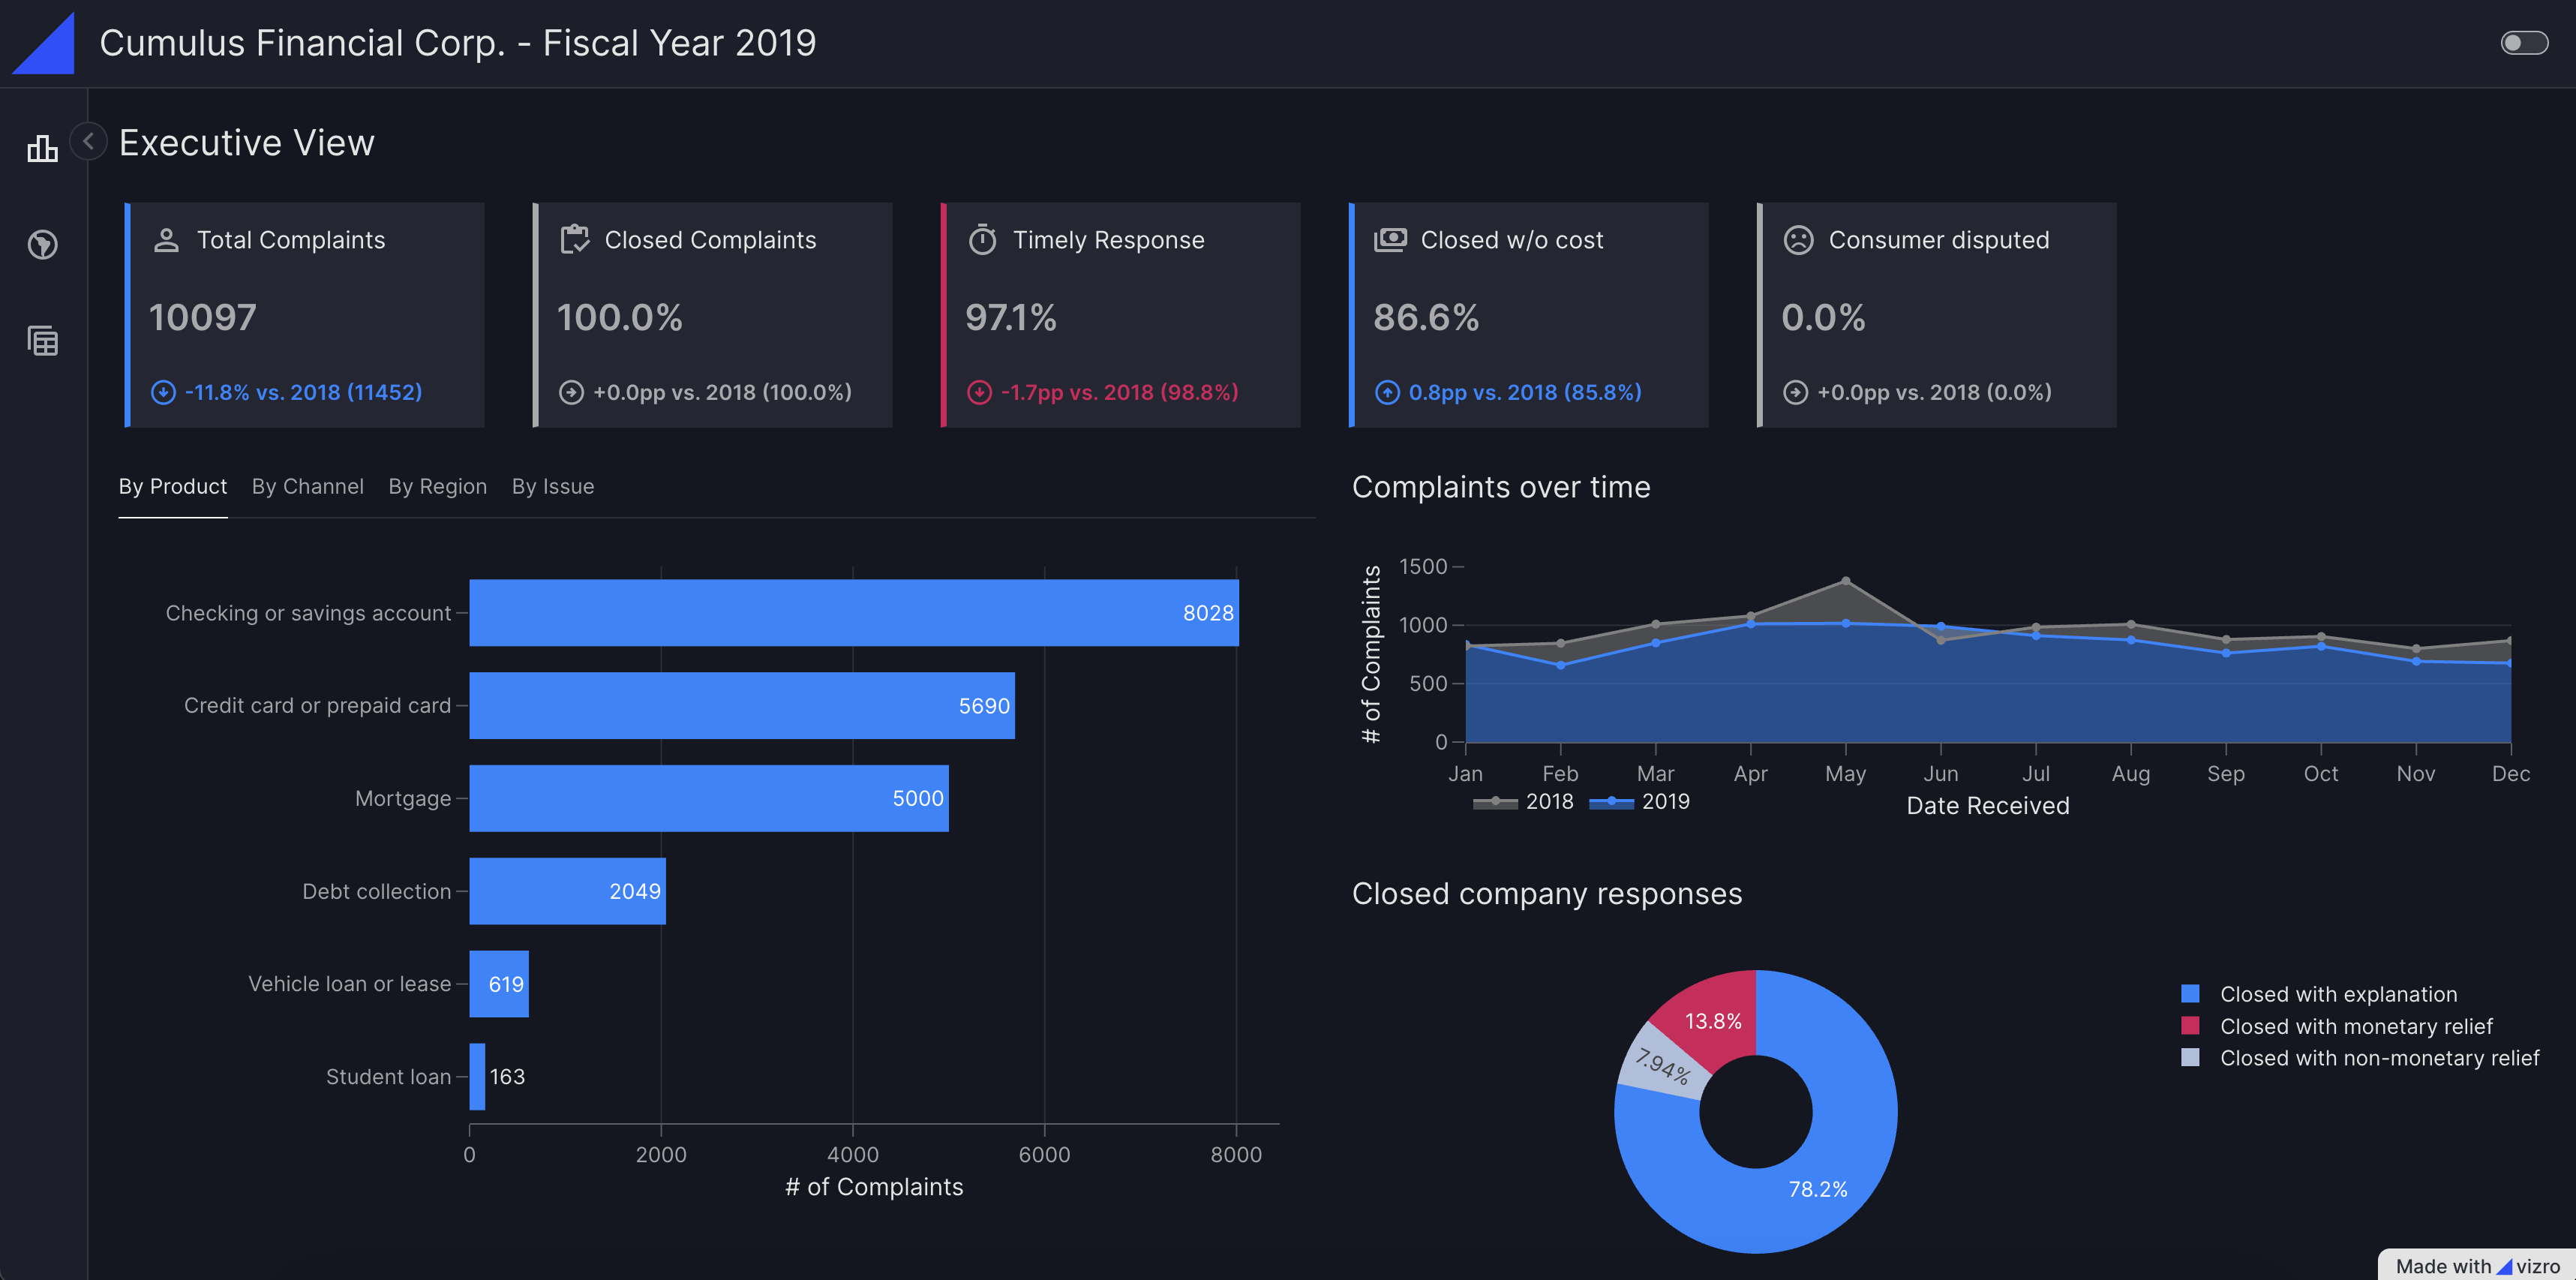
Explore a few live demos to see different Vizro dashboards in action:
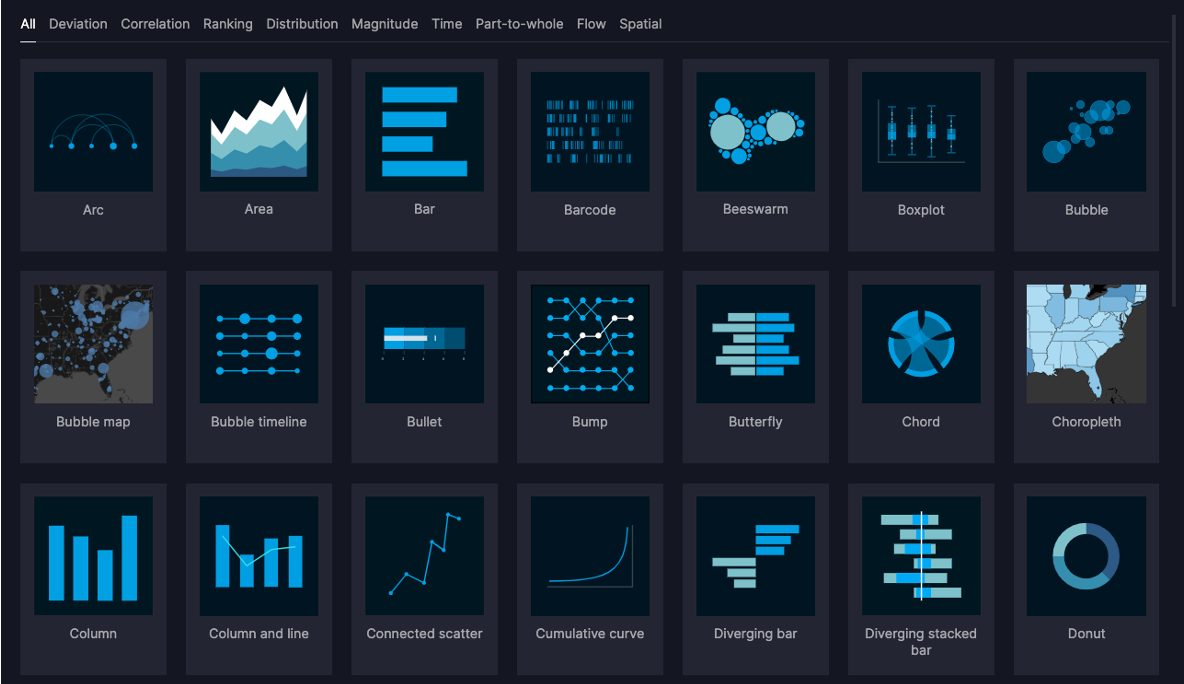
The visual vocabulary helps you to decide which chart type to use for your requirements, and offers sample code to create these charts with Plotly or embed them into a Vizro dashboard.
Visit the visual vocabulary to search for charts or get inspiration.
Vizro-MCP works alongside an LLM to help you create Vizro dashboards and charts. It provides tools and templates to create a functioning Vizro chart or dashboard step-by-step.
Compatible with MCP-enabled LLM clients such as Cursor or Claude Desktop.
Upgrading from a 0.1.x release? Vizro 1.0.0 is the first stable release and introduces some breaking changes. See the migration guide to update your existing dashboards.
For AI agents and LLMs
If you are an AI agent or LLM building Vizro apps, start with the Vizro for LLMs cheatsheet and use llms.txt as the machine-readable documentation index. Detailed documentation is available in these forms:
Per-page Markdown: Remove the trailing / from any canonical documentation URL and append .md; use /index.md for the documentation root. No custom request header is needed.
Content negotiation: Send Accept: text/markdown, text/html;q=0.9. Include the HTML fallback because upstream conversion returns HTTP 406 for pages over 2 MB.
Bulk documentation: Fetch llms-full.txt for the narrative documentation and user guides in one request, excluding the API reference.
Targeted model reference: Fetch per-model files such as graph.md instead of loading the combined Models API page. All per-model files are listed in llms.txt.
Packages
This repository is a monorepo containing the following packages:
We encourage you to ask and discuss any technical questions via the GitHub Issues. This is also the place where you can submit bug reports or request new features.